
Notice
Recent Posts
Recent Comments
Link
| 일 | 월 | 화 | 수 | 목 | 금 | 토 |
|---|---|---|---|---|---|---|
| 1 | 2 | 3 | 4 | |||
| 5 | 6 | 7 | 8 | 9 | 10 | 11 |
| 12 | 13 | 14 | 15 | 16 | 17 | 18 |
| 19 | 20 | 21 | 22 | 23 | 24 | 25 |
| 26 | 27 | 28 | 29 | 30 | 31 |
Tags
- state
- Node
- 완전탐색
- sort
- 리액트
- 코딩테스트
- node.js
- 자료구조
- 알고리즘
- 해시
- 코테
- 정렬
- react
- 정규표현식
- 프로그래머스
- 기술면접
- 브루트포스
- 최소공배수
- 합병 정렬
- 자바스크립트
- JS
- CSS
- 백준
- BOJ
- useState
- hash
- 딥다이브
- 연결리스트
- JavaScript
- 병합 정렬
Archives
- Today
- Total
가치투자자
D3 라이브러리 본문
728x90
반응형
D3.js
1. svg로 가지치기

import React from "react";

const App = () => {
  const width = 400;
  const height = 200;

  const line1 = [{ x: 50, y: 100 }, { x: 150, y: 50 }];
  const line2 = [{ x: 250, y: 100 }, { x: 350, y: 150 }];

  const renderLine = (points) => (
    <line
      x1={points[0].x}
      y1={points[0].y}
      x2={points[1].x}
      y2={points[1].y}
      stroke="black"
    />
  );

  const renderDottedLine = (point) => (
    <line
      x1={point.x}
      y1={point.y + 10}
      x2={point.x}
      y2={height - 10}
      stroke="black"  /* 점선 색깔 */
      strokeDasharray="5,5" /* 점선 길이, 점선 간격 */
    />
  );

  return (
    <svg width={width} height={height}>
      {/* 그래프 선 그리기 */}
      {renderLine(line1)}
      {renderLine(line2)}

      {/* 각 꼭지점에서의 점선 (범주 가지치기) */}
      {line1.map(renderDottedLine)}
      {line2.map(renderDottedLine)}
    </svg>
  );
};

export default App;
2. D3.js
1) 기본 문법
- d3.select("태그") : 태그 하나 선택
- d3.selectAll("태그") : 태그 전체 선택
- .attr() : 속성값을 지정하거나 가져온다
- .style : css 스타일 프로퍼티를 지정하거나 가겨온다
- .data : 데이터를 요소에 가져온다
- .append("태그") : 새로운 태그 추가
- .enter : 태그가 데이터보다 적을 경우, 데이터 수만큼 태그 생성
- .exit : 태드가 데이터보다 많을 경우, 태그 속성 지정을 종료하고 remove로 나머지 태그 제거
- remove : 선택된 태그 제거
예시 1) D3로 가지치기

import React, { useEffect, useRef } from "react";
import * as d3 from "d3";

const App = () => {
  const svgRef = useRef(null);

  useEffect(() => {
    const svg = d3.select(svgRef.current);

    const WIDTH = 400;
    const HEIGHT = 200;

    const line1 = [{ x: 50, y: 100 }, { x: 150, y: 50 }];
    const line2 = [{ x: 250, y: 100 }, { x: 350, y: 150 }];

    // 그래프 선 생성함수
    const lineGenerator = d3.line()
      .x(d => d.x)
      .y(d => d.y);

    // 선 추가
    svg
      .append("path")
      .attr("d", lineGenerator(line1))
      .attr("stroke", "black")
      .attr("fill", "none");

    svg
      .append("path")
      .attr("d", lineGenerator(line2))
      .attr("stroke", "black")
      .attr("fill", "none");

    // 점선 추가
    const addDottedLines = (points) => {
      points.forEach(point => {
        svg
          .append("line")
          .attr("x1", point.x)
          .attr("y1", point.y + 10)
          .attr("x2", point.x)
          .attr("y2", HEIGHT - 10)
          .attr("stroke", "black")
          .attr("stroke-dasharray", "5,5");
      });
    };

    addDottedLines(line1);
    addDottedLines(line2);
  }, []);

  return (
    <svg ref={svgRef} width={400} height={200}></svg>
  );
};

export default App;
예시 2-1) D3로 범주 선 그래스 생성
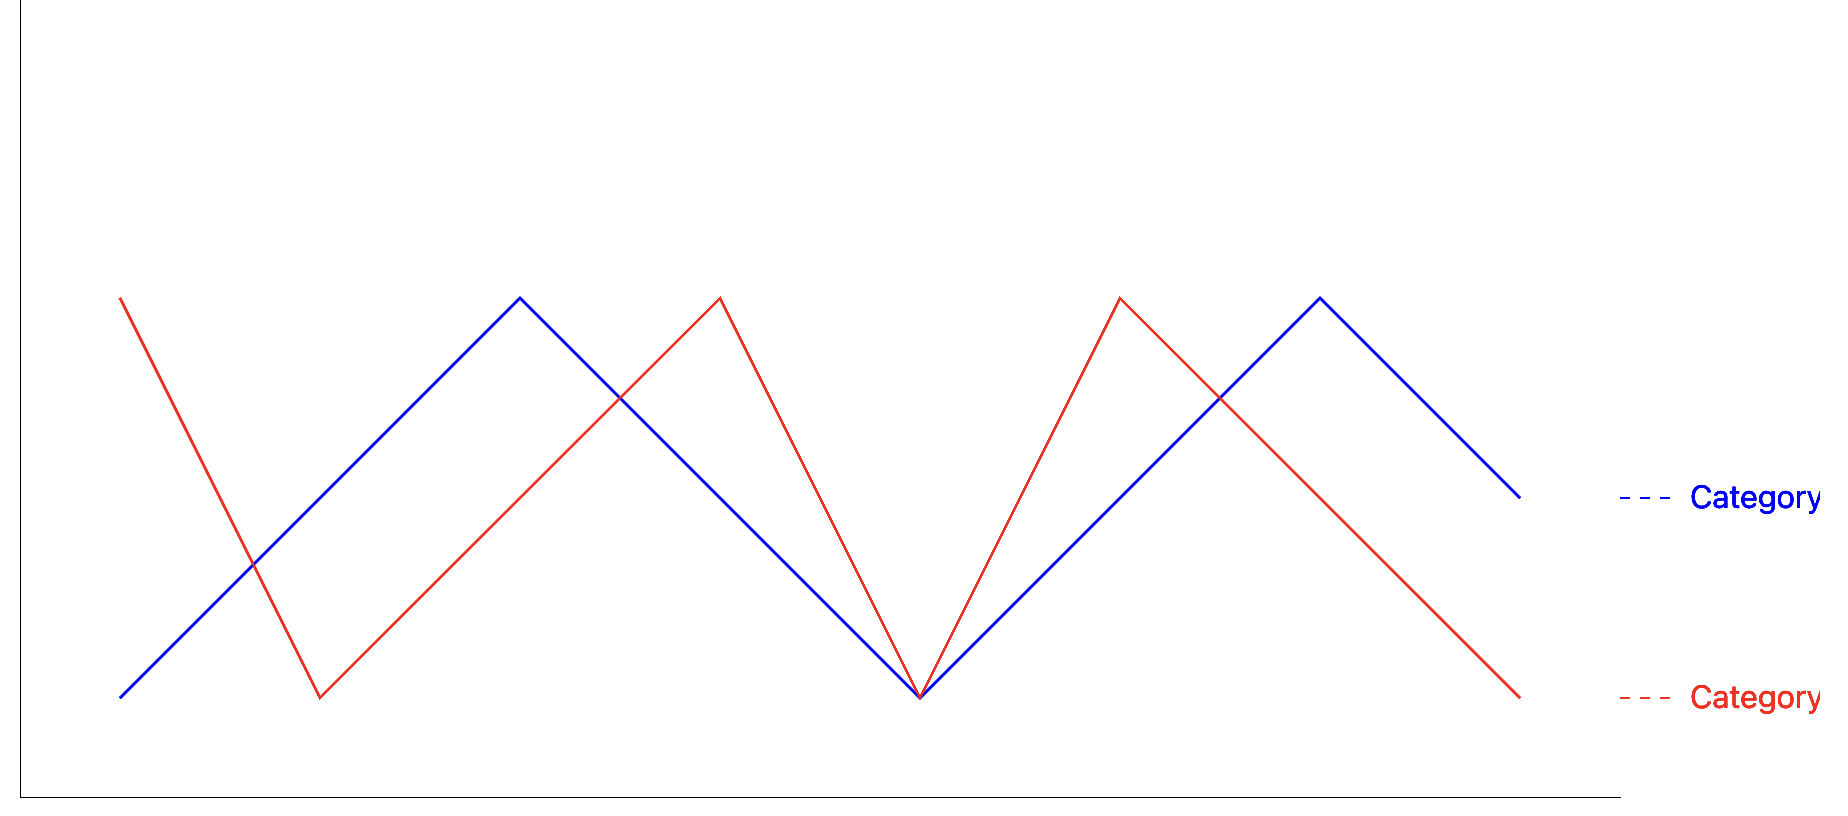
import React, { useEffect, useRef } from "react";
import * as d3 from "d3";

const App = () => {
  const svgRef = useRef(null);

  useEffect(() => {
    const svg = d3.select(svgRef.current);

    const width = 800;
    const height = 400;

    const lines = [
      {
        points: [{ x: 50, y: 350 }, { x: 150, y: 250 }, { x: 250, y: 150 }, { x: 350, y: 250 }, { x: 450, y: 350 }, { x: 550, y: 250 }, { x: 650, y: 150 }, { x: 750, y: 250 }],
        category: "Category 1"
      },
      {
        points: [{ x: 50, y: 150 }, { x: 150, y: 350 }, { x: 250, y: 250 }, { x: 350, y: 150 }, { x: 450, y: 350 }, { x: 550, y: 150 }, { x: 650, y: 250 }, { x: 750, y: 350 }],
        category: "Category 2"
      }
    ];

    // 그래프 선 생성함수
    const lineGenerator = d3.line()
      .x(d => d.x)
      .y(d => d.y);

    // 그래프 축
    const xScale = d3.scaleLinear().domain([0, width]).range([0, width]);     /* [최소값, 최대값] */
    const yScale = d3.scaleLinear().domain([0, height]).range([height, 0]);   /* 기존 간격(입력범위, domain)을 새로운 간격(출력범위, range)으로 변환 */
    const xAxis = d3.axisBottom(xScale);  /* x축 생성 */
    const yAxis = d3.axisLeft(yScale);    /* y축 생성 */
    svg.append("g").call(xAxis).attr("transform", `translate(0, ${height})`);  /* x축을 아래쪽으로 height만큼 이동 */
    svg.append("g").call(yAxis);  /* call : 축 그리기 */

    // 선 추가
    lines.forEach((line, idx) => {
      svg
        .append("path")
        .attr("d", lineGenerator(line.points))
        .attr("stroke", idx === 0 ? "blue" : "red")
        .attr("fill", "none");

      // x축 끝에 점선 추가
      svg
        .append("line")
        .attr("x1", width)
        .attr("y1", line.points[line.points.length - 1].y)  /* 그래프 선 끝 y축 높이 */
        .attr("x2", width + 30)
        .attr("y2", line.points[line.points.length - 1].y)
        .attr("stroke", idx === 0 ? "blue" : "red")
        .attr("stroke-dasharray", "5,5");

      // 범주명 추가
      svg
        .append("text")
        .attr("x", width + 35)
        .attr("y", line.points[line.points.length - 1].y + 5)
        .attr("fill", idx === 0 ? "blue" : "red")
        .text(line.category);
    });

  }, []);

  return (
    <svg ref={svgRef} width={900} height={400}></svg>
  );
};

export default App;
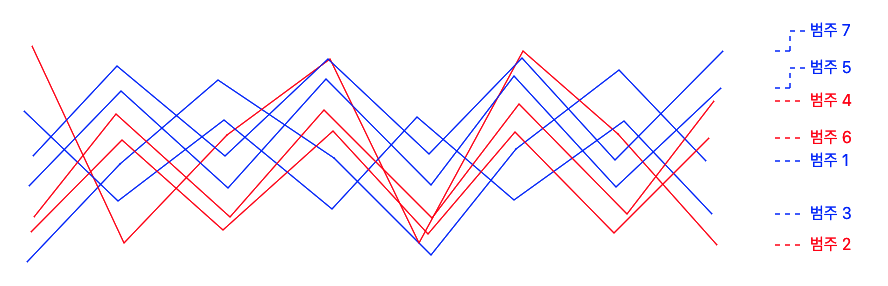
예시 2-2) 꺾이는 범주의 점선
import React, { useEffect, useRef } from "react";
import * as d3 from "d3";

const lines = [
  {
    points: [{ x: 52, y: 340 }, { x: 145, y: 242 }, { x: 243, y: 158 }, { x: 359, y: 236 }, { x: 456, y: 333 }, { x: 541, y: 227 }, { x: 644, y: 148 }, { x: 731, y: 239 }],
    category: "범주 1",
  },
  {
    points: [{ x: 57, y: 124 }, { x: 149, y: 321 }, { x: 252, y: 213 }, { x: 355, y: 137 }, { x: 444, y: 321 }, { x: 548, y: 129 }, { x: 643, y: 212 }, { x: 742, y: 323 }],
    category: "범주 2",
  },
  {
    points: [{ x: 49, y: 189 }, { x: 143, y: 279 }, { x: 249, y: 198 }, { x: 357, y: 287 }, { x: 442, y: 195 }, { x: 539, y: 278 }, { x: 649, y: 199 }, { x: 737, y: 292 }],
    category: "범주 3",
  },
  {
    points: [{ x: 59, y: 295 }, { x: 141, y: 192 }, { x: 255, y: 295 }, { x: 349, y: 188 }, { x: 457, y: 296 }, { x: 544, y: 182 }, { x: 652, y: 292 }, { x: 739, y: 179 }],
    category: "범주 4",
  },
  {
    points: [{ x: 54, y: 264 }, { x: 146, y: 169 }, { x: 253, y: 266 }, { x: 351, y: 157 }, { x: 456, y: 263 }, { x: 539, y: 154 }, { x: 641, y: 265 }, { x: 746, y: 166 }],
    category: "범주 5",
  },
  {
    points: [{ x: 56, y: 310 }, { x: 147, y: 218 }, { x: 248, y: 308 }, { x: 358, y: 209 }, { x: 453, y: 312 }, { x: 540, y: 210 }, { x: 639, y: 311 }, { x: 734, y: 216 }],
    category: "범주 6",
  },
  {
    points: [ { x: 58, y: 234 }, { x: 142, y: 144 }, { x: 250, y: 234 }, { x: 353, y: 137 }, { x: 454, y: 232 }, { x: 547, y: 136 }, { x: 640, y: 238 }, { x: 748, y: 129 }],
    category: "범주 7",
  },
];

const App = () => {
  const svgRef = useRef(null);

  // 각 범주의 위치를 저장하는 배열
  let categoriesY = [];

  useEffect(() => {
    const svg = d3.select(svgRef.current);

    categoriesY = [];   // 초기화

    const width = 800;
    const height = 400;

    // 그래프 선 생성함수
    const lineGenerator = d3.line()
      .x(d => d.x)
      .y(d => d.y);

    // 그래프 축
    const xScale = d3.scaleLinear().domain([0, width]).range([0, width]);     /* [최소값, 최대값] */
    const yScale = d3.scaleLinear().domain([0, height]).range([height, 0]);   /* 기존 간격(입력범위, domain)을 새로운 간격(출력범위, range)으로 변환 */
    const xAxis = d3.axisBottom(xScale);  /* x축 생성 */
    const yAxis = d3.axisLeft(yScale);    /* y축 생성 */
    svg.append("g").call(xAxis).attr("transform", `translate(0, ${height})`);  /* x축을 아래쪽으로 height만큼 이동 */
    svg.append("g").call(yAxis);  /* call : 축 그리기 */

    // 선 추가
    lines.forEach((line, idx) => {
      let lineEndY = line.points[line.points.length - 1].y;
      let labelY = lineEndY;

      // 범주의 위치가 다른 범주와 겹치는지 확인
      let overlaps = true;
      while (overlaps) {
        overlaps = false;
        for (let y of categoriesY) {
          if (Math.abs(y - labelY) < 20) { // 20은 글자 크기에 따라 조정 가능
            labelY -= 20; // 위로 20만큼 이동
            overlaps = true; // 겹치는 것을 발견하면 overlaps를 true로 설정
            break;
          }
        }
      }
      categoriesY.push(labelY);

      svg.append("path")
         .attr("d", lineGenerator(line.points))
         .attr("stroke", idx % 2 === 0 ? "blue" : "red")
         .attr("fill", "none");

      // x축 끝에 점선 추가
      svg.append("line")
         .attr("x1", width)
         .attr("y1", lineEndY)  /* 그래프 선 끝 y축 높이 */
         .attr("x2", width + (lineEndY !== labelY ? 15 : 30))  // 꺾는 선이 있는 경우에는 좌표를 조정
         .attr("y2", lineEndY)
         .attr("stroke", idx % 2 === 0 ? "blue" : "red")
         .attr("stroke-dasharray", "5,5");

      if (lineEndY !== labelY) {  // 꺾는 선이 필요한 경우
        svg.append("line")
           .attr("x1", width + 15)
           .attr("y1", lineEndY)
           .attr("x2", width + 15)
           .attr("y2", labelY)
           .attr("stroke", idx % 2 === 0 ? "blue" : "red")
           .attr("stroke-dasharray", "5,5");

        svg.append("line")
           .attr("x1", width + 15)
           .attr("y1", labelY)
           .attr("x2", width + 30)
           .attr("y2", labelY)
           .attr("stroke", idx % 2 === 0 ? "blue" : "red")
           .attr("stroke-dasharray", "5,5");
      }

      // 범주명 추가
      svg.append("text")
         .attr("x", width + 35)
         .attr("y", labelY + 5)
         .attr("fill", idx % 2 === 0 ? "blue" : "red")
         .text(line.category);
    });

  }, []);

  return (
    <svg ref={svgRef} width={900} height={400}></svg>
  );
};

export default App;
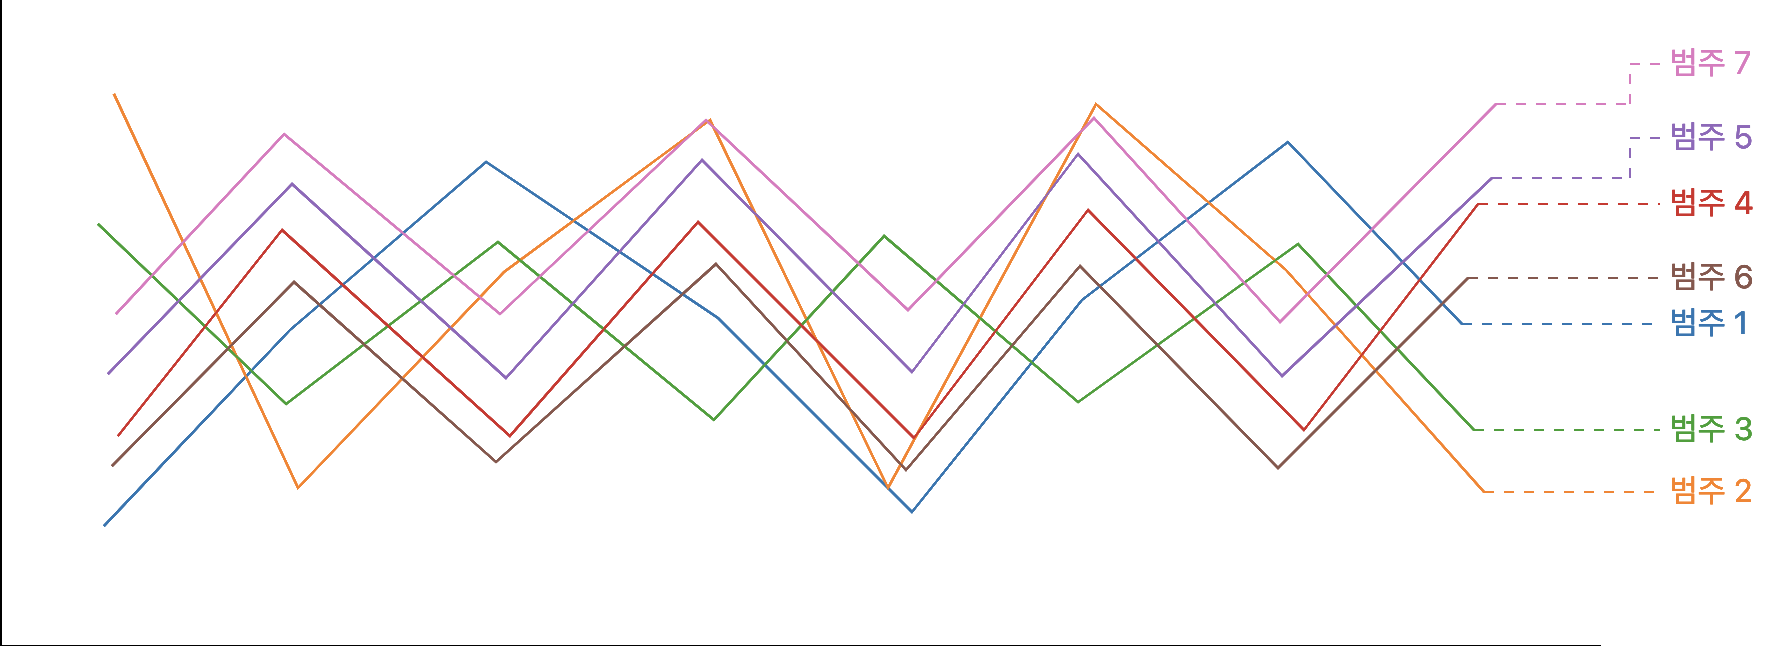
예시 2-3) 차트 색상 구별 및 차트와 점선 연결
import React, { useEffect, useRef } from "react";
import * as d3 from "d3";

const lines = [
  {
    points: [{ x: 52, y: 340 }, { x: 145, y: 242 }, { x: 243, y: 158 }, { x: 359, y: 236 }, { x: 456, y: 333 }, { x: 541, y: 227 }, { x: 644, y: 148 }, { x: 731, y: 239 }],
    category: "범주 1",
  },
  {
    points: [{ x: 57, y: 124 }, { x: 149, y: 321 }, { x: 252, y: 213 }, { x: 355, y: 137 }, { x: 444, y: 321 }, { x: 548, y: 129 }, { x: 643, y: 212 }, { x: 742, y: 323 }],
    category: "범주 2",
  },
  {
    points: [{ x: 49, y: 189 }, { x: 143, y: 279 }, { x: 249, y: 198 }, { x: 357, y: 287 }, { x: 442, y: 195 }, { x: 539, y: 278 }, { x: 649, y: 199 }, { x: 737, y: 292 }],
    category: "범주 3",
  },
  {
    points: [{ x: 59, y: 295 }, { x: 141, y: 192 }, { x: 255, y: 295 }, { x: 349, y: 188 }, { x: 457, y: 296 }, { x: 544, y: 182 }, { x: 652, y: 292 }, { x: 739, y: 179 }],
    category: "범주 4",
  },
  {
    points: [{ x: 54, y: 264 }, { x: 146, y: 169 }, { x: 253, y: 266 }, { x: 351, y: 157 }, { x: 456, y: 263 }, { x: 539, y: 154 }, { x: 641, y: 265 }, { x: 746, y: 166 }],
    category: "범주 5",
  },
  {
    points: [{ x: 56, y: 310 }, { x: 147, y: 218 }, { x: 248, y: 308 }, { x: 358, y: 209 }, { x: 453, y: 312 }, { x: 540, y: 210 }, { x: 639, y: 311 }, { x: 734, y: 216 }],
    category: "범주 6",
  },
  {
    points: [ { x: 58, y: 234 }, { x: 142, y: 144 }, { x: 250, y: 234 }, { x: 353, y: 137 }, { x: 454, y: 232 }, { x: 547, y: 136 }, { x: 640, y: 238 }, { x: 748, y: 129 }],
    category: "범주 7",
  },
];

const App = () => {
  const svgRef = useRef(null);  // React ref를 사용하여 SVG 엘리먼트를 참조합니다.

  // 각 범주의 Y 위치를 저장하는 배열
  let categoriesY = [];

  useEffect(() => {
    const svg = d3.select(svgRef.current);  // D3로 SVG 엘리먼트를 선택합니다.

    categoriesY = [];   // 범주의 Y 위치 배열을 초기화

    const width = 800;
    const height = 400;

    // 그래프 선 생성함수
    const lineGenerator = d3.line()
      .x(d => d.x)
      .y(d => d.y);

    // 그래프 축
    const xScale = d3.scaleLinear().domain([0, width]).range([0, width]);     /* [최소값, 최대값] */
    const yScale = d3.scaleLinear().domain([0, height]).range([height, 0]);   /* 기존 간격(입력범위, domain)을 새로운 간격(출력범위, range)으로 변환 */
    const xAxis = d3.axisBottom(xScale);  /* x축 생성 */
    const yAxis = d3.axisLeft(yScale);    /* y축 생성 */
    svg.append("g").call(xAxis).attr("transform", `translate(0, ${height})`);  /* x축을 아래쪽으로 height만큼 이동 */
    svg.append("g").call(yAxis);  /* call : 축 그리기 */

    // 색상 스케일을 정의
    const colorScale = d3.scaleOrdinal(d3.schemeCategory10); // D3의 기본 10가지 카테고리 컬러를 사용

    // 선 추가 : 각 선 데이터를 순회하면서 그래프 생성
    lines.forEach((line, idx) => {
      const lineColor = colorScale(idx); // idx를 기반으로 색상을 지정
      let lineEndX = line.points[line.points.length - 1].x;  /* 마지막 x 좌표 */
      let lineEndY = line.points[line.points.length - 1].y;  /* 마지막 y 좌표 */
      let labelY = lineEndY;

      // 범주의 위치가 다른 범주와 겹치는지 확인
      let overlaps = true;
      while (overlaps) {
        overlaps = false;
        for (let y of categoriesY) {
          if (Math.abs(y - labelY) < 20) { // 20은 글자 크기에 따라 조정 가능
            labelY -= 20; // 위로 20만큼 이동
            overlaps = true; // 겹치는 것을 발견하면 overlaps를 true로 설정
            break;
          }
        }
      }
      categoriesY.push(labelY);  // 조정된 Y 위치를 배열에 추가

      // 선 추가
      svg.append("path")
         .attr("d", lineGenerator(line.points))
         .attr("stroke", lineColor)
         .attr("fill", "none");

      // x축 끝에 점선 추가
      svg.append("line")
         .attr("x1", lineEndX)
         .attr("y1", lineEndY)  /* 그래프 선 끝 y축 높이 */
         .attr("x2", lineEndY !== labelY ? width + 15 : width + 27)  // 꺾는 선이 있는 경우에는 좌표를 조정
         .attr("y2", lineEndY)
         .attr("stroke", lineColor)
         .attr("stroke-dasharray", "5,5");

      // 꺾는 선이 필요한 경우
      if (lineEndY !== labelY) {
        svg
          .append("line")
          .attr("x1", width + 15)
          .attr("y1", lineEndY)
          .attr("x2", width + 15)
          .attr("y2", labelY)
          .attr("stroke", lineColor)
          .attr("stroke-dasharray", "5,5");

        svg.append("line")
           .attr("x1", width + 15)
           .attr("y1", labelY)
           .attr("x2", width + 30)
           .attr("y2", labelY)
           .attr("stroke", lineColor)
           .attr("stroke-dasharray", "5,5");
      }

      // 범주명 추가
      svg.append("text")
         .attr("x", width + 35)
         .attr("y", labelY + 5)
         .attr("fill", lineColor)
         .text(line.category);
    });

  }, []);

  return (
    <svg ref={svgRef} width={900} height={400}></svg>
  );
};

export default App;
예시 2-4) 툴팁 기능 추가

import React, { useEffect, useRef } from "react";
import * as d3 from "d3";

const lines = [
  {
    points: [{ x: 52, y: 340 }, { x: 145, y: 242 }, { x: 243, y: 158 }, { x: 359, y: 236 }, { x: 456, y: 333 }, { x: 541, y: 227 }, { x: 644, y: 148 }, { x: 731, y: 239 }],
    category: "범주 1",
  },
  {
    points: [{ x: 57, y: 124 }, { x: 149, y: 321 }, { x: 252, y: 213 }, { x: 355, y: 137 }, { x: 444, y: 321 }, { x: 548, y: 129 }, { x: 643, y: 212 }, { x: 742, y: 323 }],
    category: "범주 2",
  },
  {
    points: [{ x: 49, y: 189 }, { x: 143, y: 279 }, { x: 249, y: 198 }, { x: 357, y: 287 }, { x: 442, y: 195 }, { x: 539, y: 278 }, { x: 649, y: 199 }, { x: 737, y: 292 }],
    category: "범주 3",
  },
  {
    points: [{ x: 59, y: 295 }, { x: 141, y: 192 }, { x: 255, y: 295 }, { x: 349, y: 188 }, { x: 457, y: 296 }, { x: 544, y: 182 }, { x: 652, y: 292 }, { x: 739, y: 179 }],
    category: "범주 4",
  },
  {
    points: [{ x: 54, y: 264 }, { x: 146, y: 169 }, { x: 253, y: 266 }, { x: 351, y: 157 }, { x: 456, y: 263 }, { x: 539, y: 154 }, { x: 641, y: 265 }, { x: 746, y: 166 }],
    category: "범주 5",
  },
  {
    points: [{ x: 56, y: 310 }, { x: 147, y: 218 }, { x: 248, y: 308 }, { x: 358, y: 209 }, { x: 453, y: 312 }, { x: 540, y: 210 }, { x: 639, y: 311 }, { x: 734, y: 216 }],
    category: "범주 6",
  },
  {
    points: [ { x: 58, y: 234 }, { x: 142, y: 144 }, { x: 250, y: 234 }, { x: 353, y: 137 }, { x: 454, y: 232 }, { x: 547, y: 136 }, { x: 640, y: 238 }, { x: 748, y: 129 }],
    category: "범주 7",
  },
];

const App = () => {
  const svgRef = useRef(null);  // React ref를 사용하여 SVG 엘리먼트를 참조합니다.
  const tooltipRef = useRef(null);  // 툴팁을 위한 ref
  let categoriesY = [];  // 각 범주의 Y 위치를 저장하는 배열

  useEffect(() => {
    const svg = d3.select(svgRef.current);  // D3로 SVG 엘리먼트를 선택합니다.
    const tooltip = d3.select(tooltipRef.current);

    categoriesY = [];  // 범주의 Y 위치 배열을 초기화

    const width = 800;
    const height = 400;

    // 그래프 선 생성함수
    const lineGenerator = d3.line()
      .x(d => d.x)
      .y(d => d.y);

    // 그래프 축
    const xScale = d3.scaleLinear().domain([0, width]).range([0, width]);    /* [최소값, 최대값] */
    const yScale = d3.scaleLinear().domain([0, height]).range([height, 0]);  /* 기존 간격(입력범위, domain)을 새로운 간격(출력범위, range)으로 변환 */
    const xAxis = d3.axisBottom(xScale);  /* x축 생성 */
    const yAxis = d3.axisLeft(yScale);    /* y축 생성 */
    svg.append("g").call(xAxis).attr("transform", `translate(0, ${height})`);  /* x축을 아래쪽으로 height만큼 이동 */
    svg.append("g").call(yAxis);  /* call : 축 그리기 */

    // 색상 스케일을 정의
    const colorScale = d3.scaleOrdinal(d3.schemeCategory10);  // D3의 기본 10가지 카테고리 컬러를 사용

    // 선 추가 : 각 선 데이터를 순회하면서 그래프 생성
    lines.forEach((line, idx) => {
      const lineColor = colorScale(idx);  // idx를 기반으로 색상을 지정
      let lineEndX = line.points[line.points.length - 1].x;  /* 마지막 x 좌표 */
      let lineEndY = line.points[line.points.length - 1].y;  /* 마지막 y 좌표 */
      let labelY = lineEndY;

      // 범주의 위치가 다른 범주와 겹치는지 확인
      let overlaps = true;
      while (overlaps) {
        overlaps = false;
        for (let y of categoriesY) {
          if (Math.abs(y - labelY) < 20) {  // 20은 글자 크기에 따라 조정 가능
            labelY -= 20;     // 위로 20만큼 이동
            overlaps = true;  // 겹치는 것을 발견하면 overlaps를 true로 설정
            break;
          }
        }
      }
      categoriesY.push(labelY);  // 조정된 Y 위치를 배열에 추가

      // x축 끝에 점선 추가
      svg
        .append("line")
        .attr("x1", lineEndX)
        .attr("y1", lineEndY)  /* 그래프 선 끝 y축 높이 */
        .attr("x2", lineEndY !== labelY ? width + 15 : width + 27)  // 꺾는 선이 있는 경우에는 좌표를 조정
        .attr("y2", lineEndY)
        .attr("stroke", lineColor)
        .attr("stroke-dasharray", "5,5");

      // 꺾는 선이 필요한 경우
      if (lineEndY !== labelY) {
        svg
          .append("line")
          .attr("x1", width + 15)
          .attr("y1", lineEndY)
          .attr("x2", width + 15)
          .attr("y2", labelY)
          .attr("stroke", lineColor)
          .attr("stroke-dasharray", "5,5");

        svg
          .append("line")
          .attr("x1", width + 15)
          .attr("y1", labelY)
          .attr("x2", width + 30)
          .attr("y2", labelY)
          .attr("stroke", lineColor)
          .attr("stroke-dasharray", "5,5");
      }

      // 범주명 추가
      svg
        .append("text")
        .attr("x", width + 35)
        .attr("y", labelY + 5)
        .attr("fill", lineColor)
        .text(line.category);

      // 선 추가
      const path = svg
        .append("path")
        .attr("d", lineGenerator(line.points))
        .attr("stroke", lineColor)
        .attr("fill", "none");

      // 툴팁 이벤트 추가
      path
        .on("mouseover", (event, d) => {
          tooltip
            .style("left", `${event.pageX + 10}px`)
            .style("top", `${event.pageY - 10}px`)
            .style("display", "inline-block")
            .html(`${line.category}`);
        })
        .on("mouseout", () => {
          tooltip.style("display", "none");
        });
    });
  }, []);

  return (
    <>
      <svg ref={svgRef} width={900} height={400}></svg>
      <div
        ref={tooltipRef}
        style={{
          position: "absolute",
          display: "none",
          background: "#f9f9f9",
          border: "1px solid #ccc",
          padding: "10px",
          borderRadius: "10px",
          pointerEvents: "none"
        }}
      ></div>
    </>
  );
};

export default App;
728x90
반응형
'Programming > JavaScript' 카테고리의 다른 글
| [JS/기술면접] 동기와 비동기 프로그래밍 (0) | 2023.04.24 |
|---|---|
| [JS/기술면접] 타이머와 디바운스 및 스로틀 (0) | 2023.04.23 |
| [JS/기술면접] 이벤트 (Event) (1) (0) | 2023.04.07 |
| [JS/기술면접] 스코프(scope)란? (0) | 2023.04.04 |
| [JS/기술면접] 객체지향 프로그래밍 및 프로토타입(prototype) (0) | 2023.04.03 |
'Programming/JavaScript' Related Articles
more


